


The Proven Guide to Building Your Ideal Customer Profile (ICP)
Step-by-Step Framework with Templates, Real Examples, and AI Prompts to Save You Time

Read time: 12 min
Welcome to a new 🔒 subscriber-only edition 🔒 of my weekly newsletter of Outbound Kitchen. Each week I dive into reader questions about scaling outbound and making it your #1 growth engine. For more: Live Outbound Classes | Podcast
Still in 2024, most outbound efforts fail because teams chase the wrong accounts. Yep, even today, companies are still making the same mistakes, and wonder why outbound is dead.
The ugly truth:
SDRs waste hours chasing dead-end accounts.
AEs spend time on deals that will never close.
CSMs fight churn because those accounts were bad fits from day one.
Translation? You’re burning time, energy, and cash.
The worst part?
This problem is sneaky, it doesn’t show up clearly in reports but quietly bleeds your business dry.
Why this happens
It all starts with your ICP (Ideal Customer Profile).
Most companies don’t take ICP seriously enough, and here’s where they go wrong:
Confusing TAM (Total Addressable Market) with ICP.
Relying on junior reps to pick accounts.
Using shallow data like LinkedIn headcount + industry to define your targets.
Chasing “shiny” accounts that seem cool but lack substance.
Targeting the entire TAM instead of focusing on what works.
What happens If You don’t fix this? If you keep running outbound without refining your ICP, here’s what you’re signing up for:
Your sales team will be stuck in an endless grind.
You’ll keep losing deals and wasting resources, and say Outbound is dead.
Churn will quietly eat away at your revenue.
Scaling outbound? Forget about it, it’ll fail before you even start.
The Fix: Build a Real ICP (and Know What Level You’re At)
To succeed in outbound, you need to know your ICP inside-out.
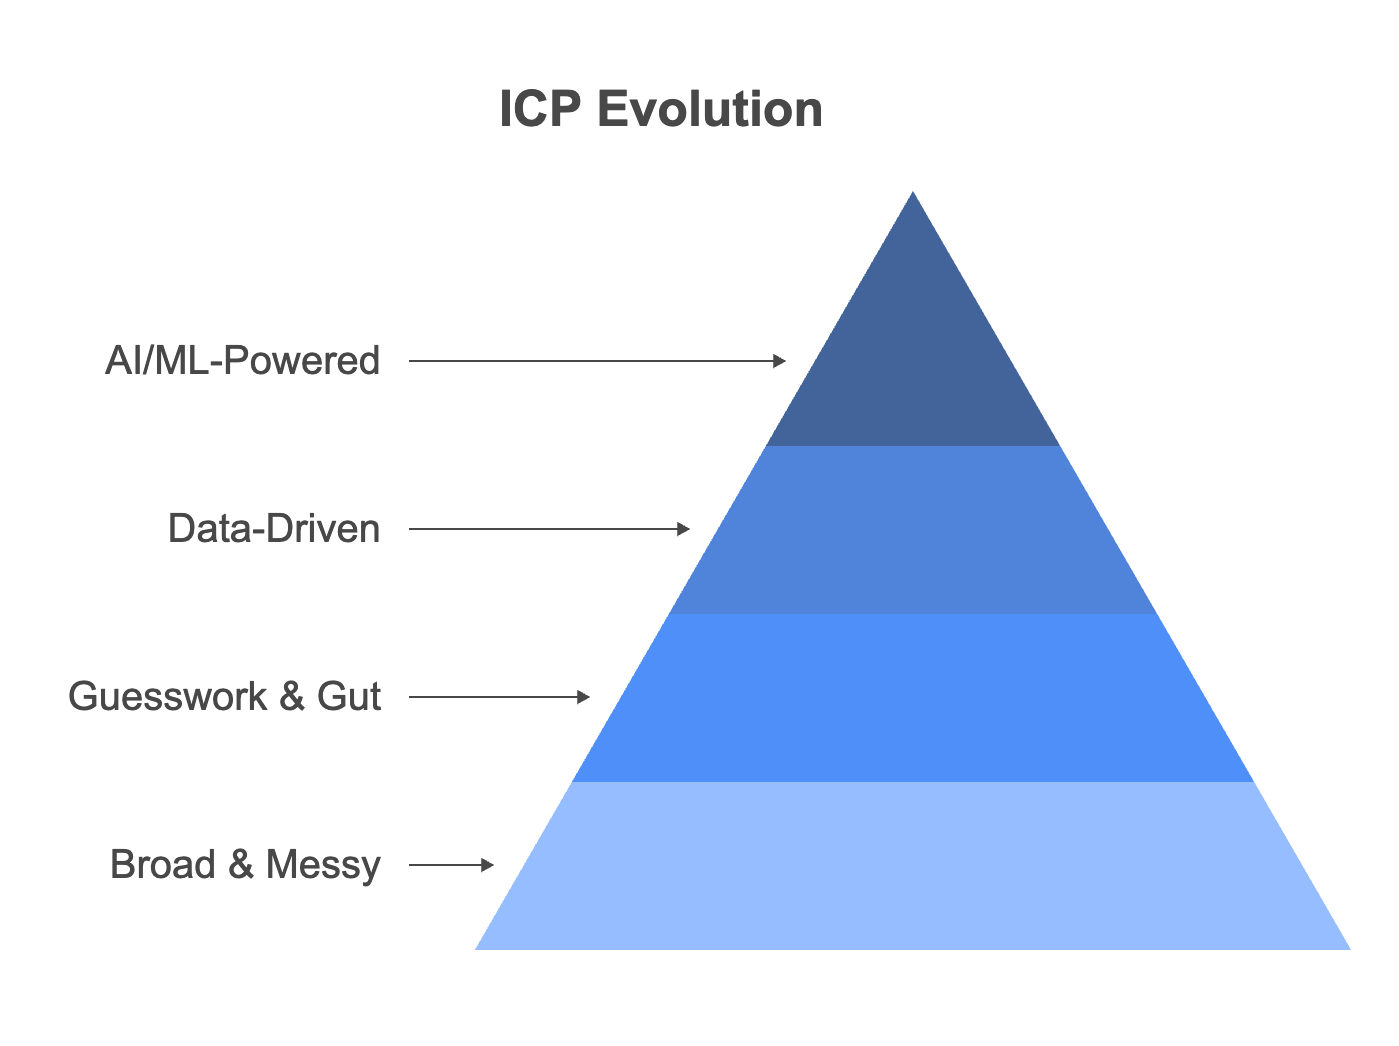
I’ve broken it down into 4 levels:
V1: Broad & messy: You’re targeting your TAM and hoping for the best.
V2: Gut-based guesses: Better than V1, but still far from scalable.
V3: Data-driven ICPs: Finally, you’re using real insights to refine your approach.
V4: AI/ML-powered precision: Welcome to the future, where your ICP evolves with every deal.
Where are you at?
Most companies are stuck in V1 or V2. I’ve been there too: 4 out of the 5 companies I worked at were in this messy zone.
But here’s the truth: You can’t scale outbound without fixing your ICP first.
Scaling outbound isn’t about hiring more reps or sending more emails. Start with your ICP, refine it, and let it guide every move you make.
Today, I’ll unpack how you can get to V3 or V4, with real examples you can apply to your own business. Spoiler: I only know 2 companies that are at V4 today!
The Step-by-step Guide on Creating Your ICP
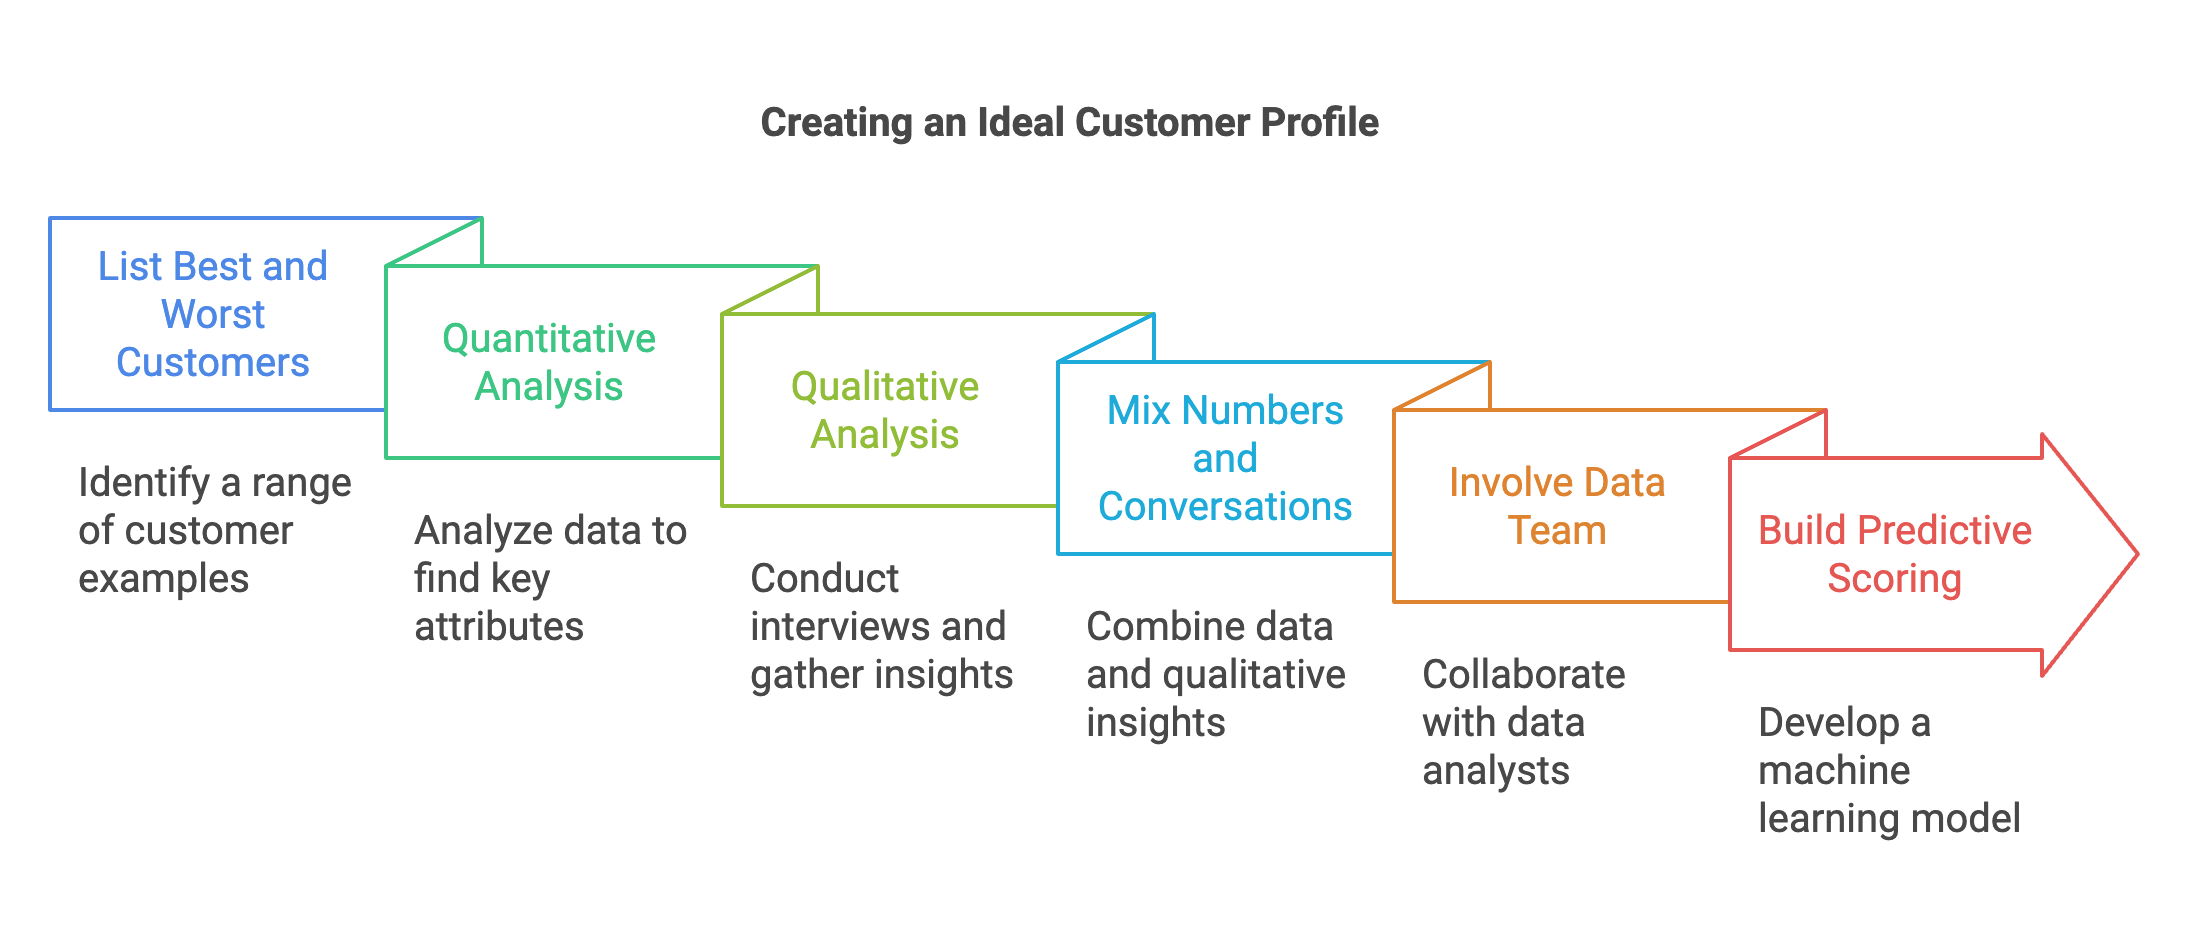
Step 1: List Your Best and Worst Customers
Step 2: Quantitative Analysis and Key Attribute Identification
Step 3: The Human Touch: Qualitative Analysis
Step 4: Find Your ICP by Mixing Numbers and Real Conversations
Step 5: Involve Your Data Team
Step 6: Build a predictive scoring with Machine Learning
Template
AI prompt
Resources for deep learning
Let’s get cooking!
The Recipe for Creating Your ICP
Step 1: List Your Best and Worst Customers
Start by analyzing both your best customers and bad customers to define who you should, and shouldn’t target.
What to Look for in Your Best Customers:
High LTV (lifetime value) or ACV (average contract value).
High Win Rate, NRR (net revenue retention), and low Churn.
Strong expansion potential, do they still have untapped opportunities?
What to Look for in Bad Customers:
Segments with high churn or no ability to expand.
Mismatched needs that don’t align with your product.
The Goal: Segmentation That Works
Break your accounts into these tiers:
Tier 1: 1:1 accounts: personalized, high-touch.
Tier 2: 1:few accounts: semi-personalized.
Tier 3: 1:many accounts: scalable, lower-touch.
Tier 4: Do not touch: waste of time, and money.
At Chili Piper: Accounts using CRMs we don’t integrate with, like Pipedrive or Microsoft Dynamics, were Tier 4.
At Castordoc: Legacy/on-prem solutions were a no-go, wasted effort.
Real example:
When Kyle Norton joined Owner.com as CRO, one of his first moves was redefining their ICP. Why? Their growth was held back by churn, inefficiencies, and bad-fit customers.
Step 1: Data-Driven Decisions: Kyle worked with the ops team to analyze customer data:
Digital presence: Web traffic, reviews, and marketplace activity.
Built a machine-learning score called Expected GMV to predict high-value customers.
Step 2: Narrow Focus: They tightened their ICP, saying no to accounts that didn’t fit, even if it hurt short-term growth.
Step 3: Tackling Churn: The team fixed issues like:
Bad targeting = bad customers.
Misaligned expectations = early churn.
Why This Worked
Clear ICP = aligned sales and onboarding teams.
Higher efficiency = fewer wasted resources on bad leads.
The Results: In just 22 months, Owner.com went from $3M to $21M ARR: Lower CAC, Better retention, and scaled outbound.
Step 2: Quantitative Analysis and Key Attribute Identification
Here’s how to make it work:
Step 1: Identify Patterns
Step 2: Focus on Key Attributes
Step 3: Enrich your Data with Online Data
Step 4: Create Your ICP Blueprint
Step 1: Identify Patterns
What do your best customers have in common? Do you have great customers within different industries? What part of your product do they use? All your products?
CRM Data: Look for shared traits in top customers, industries, team sizes, usage patterns. Example:
CastorDoc found 3 core industries: SaaS, Fintech, and Ecommerce
Chili Piper found 1 industry: SaaS with Salesforce or Hubspot users but we identified sub-industries like Cybersecurity products, products for restaurants, etc
Account Enrichment (See step 3 for more info): Use tools like Clay, ZoomInfo, Cognism, or other data/scraping tools to fill gaps in your CRM and enrich prospect and customer data for consistency.
Step 2: Focus on Key Attributes
Demographics:
Location: Country. Single location, Multiple locations: cities, state, nationally, and internationally.
Employee Count or Team Size: If you sell a seat-based solution, look at the size of end-user teams:
Chili Piper: Number of GTM team members (SDRs, AEs, etc.).
Deel: How many employees work internationally?
Rippling: Total employee count.
Industry/Sub-industries (not the ones you see on LinkedIn)
Team structures: For example, the SDR/AE model is standard in B2B SaaS but rare outside SaaS.
Revenue: High-growth vs. established companies.
Work Style: Remote, hybrid, or in-office?
Technographics:
Current tech stack: Tools they’re already using.
Integrations: Compatibility with your solution.
Example: Chili Piper targets only Salesforce or Hubspot users because they only integrate with those CRMs.
Timing:
Intent, signals, whatever you call it. I’ll break this down in another newsletter, covering what works today based on your stage. Stay tuned!
Behavioral Insights:
Are your prospects and customers they early adopters or slow movers?
Here’s how to spot the laggards:
Outdated website tech.
Weak online presence or using dead social media platforms.
Clinging to legacy systems long after everyone else has moved on.

Example:
Castordoc:
The Problem: We wasted time on accounts transitioning from on-prem to data cloud solutions. They had great titles like our ICP but didn’t have the tools or problems we could solve.
The Fix: Focused only on companies using a modern data stack, reducing the account list from 36k to 3k truly relevant accounts: the innovators/early adopters.
Owner.com:
Their GTM team adjusts the outbound messaging based on tech adoption:
If the prospect uses Uber Eats or DoorDash (early adopters/Early Majority), they focus on how to optimize with third-party delivery tools.
If they don’t use anything (laggards), the message shifts to educating them on online ordering and the revenue they’re missing out on.
Potential ACV:
Correlate deal size with company metrics.
Example:
Chili Piper’s deal size grows with the number of GTM reps.
The Problem: We wasted resources chasing “Enterprise” accounts that weren’t truly enterprise for us, like companies with 2,000 employees but only 20 GTM reps. Result? Deals capped at $30K ACV.
The Fix: We focused on accounts with 300+ GTM team members. Why? Because those accounts had the potential for $100K–$250K ACV (Or more).
Step 3: Enrich your Data with Online Data
This step is often forgotten to refine ICP.
For Non-Digital Industries:
There’s always data! For a B2B solar panel company, I used tools to measure factory roof sizes or even AI for estimates.
For a SaaS company in agriculture, I found data the same way.
Bonus: I added an AI prompt at the end of this newsletter to help you uncover hidden online data.
Technographics: The apps/tech they use in their stack
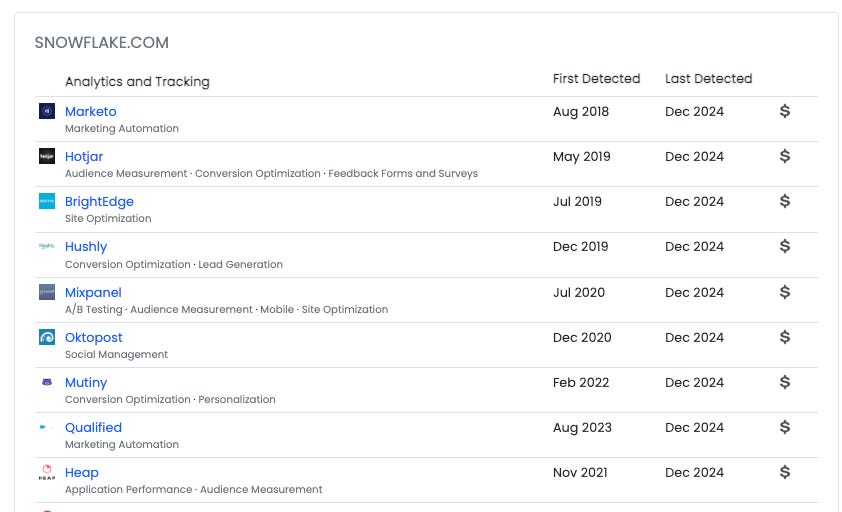
Web Tools: Use BuiltWith (or their Chrome Extension) to check what tech your prospects use, when they started, when it was last detected, and if they’re paying for it. But heads up: just because a website shows HubSpot doesn’t mean they’re using it as their CRM.
At Chili Piper:
we saw this a lot, many customers used HubSpot for marketing automation but relied on Salesforce as their CRM. Don’t assume. Always double-check.
If a company used Marketo, Hubspot, or Pardot, it was a clear sign they invested in their tech stack—making them a perfect fit for us.

Finding Hidden Tech Stacks (CRMs, Data Warehouses, BI Tools, etc.):
Data providers (like Cognism, Amplemarket, etc): but don’t fully rely on them.
At Chili Piper we used a tool from Oracle to identify companies using Salesforce. The problem? It was only accurate for about 50% of companies.
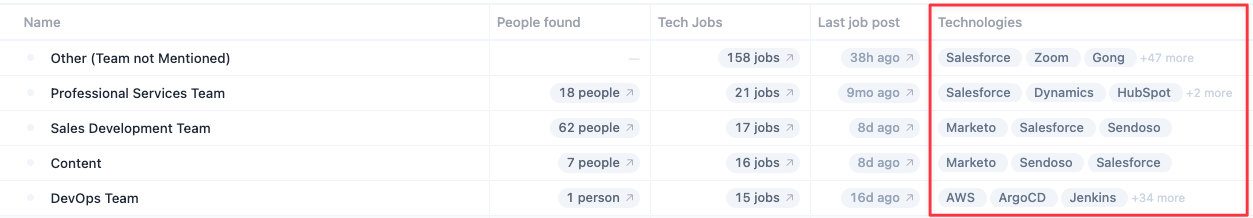
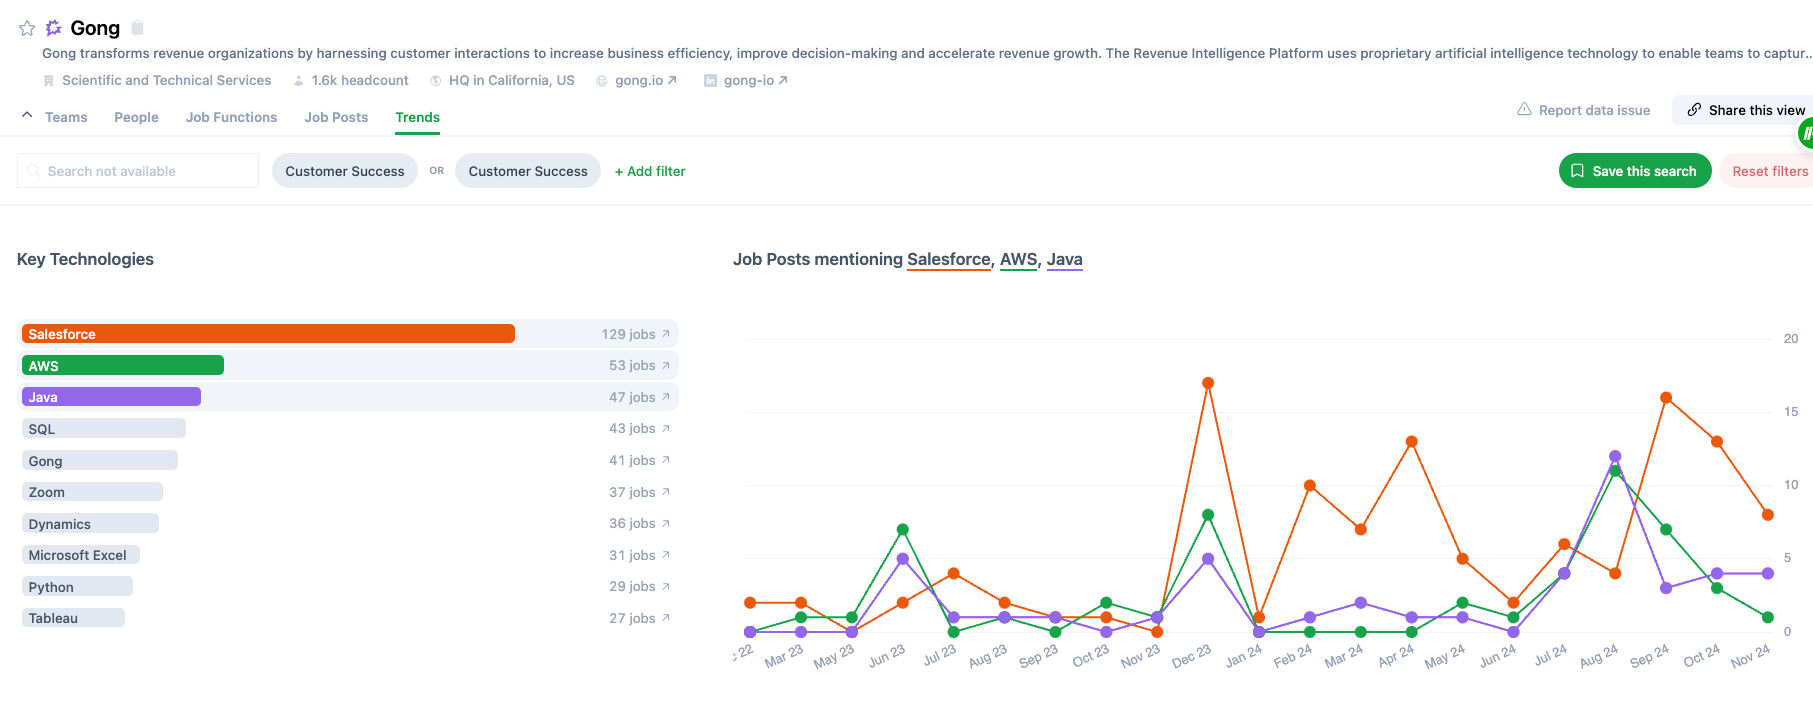
Job posting: Sometimes job descriptions list the tools they use. Instead of manually searching, check out tools like Sumble (found this 2 months ago), it scans job postings to map tech stacks for you. Example: Sales ops roles mentioning Salesforce = likely using Salesforce as their CRM. Example:

LinkedIn profiles:
Look for job titles like “Salesforce Developer” (huge hint they’re using Salesforce).
Read role descriptions, they often reveal tools the team works with.
Partner Data: Tools like Crossbeam or Reveal are gold for account mapping and identifying shared tech stacks.
At Castordoc, we were using our partner data with Crossbeam/Reveal to map accounts using the tools we integrated with.
Industry Sources:
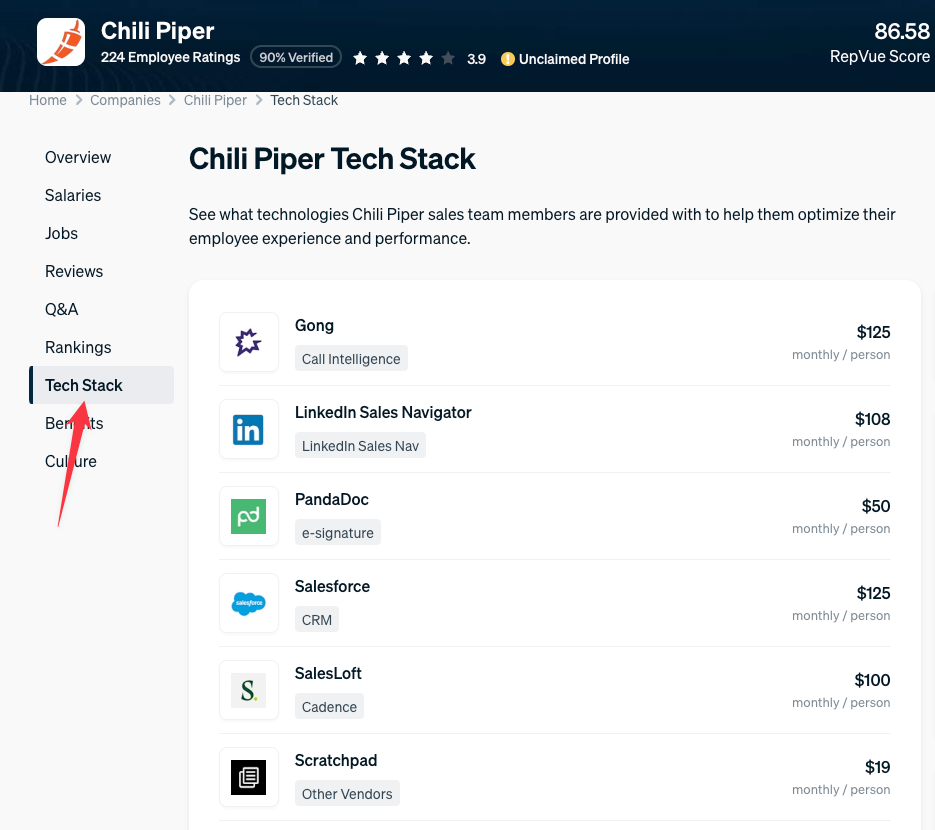
Check Repvue for GTM teams:
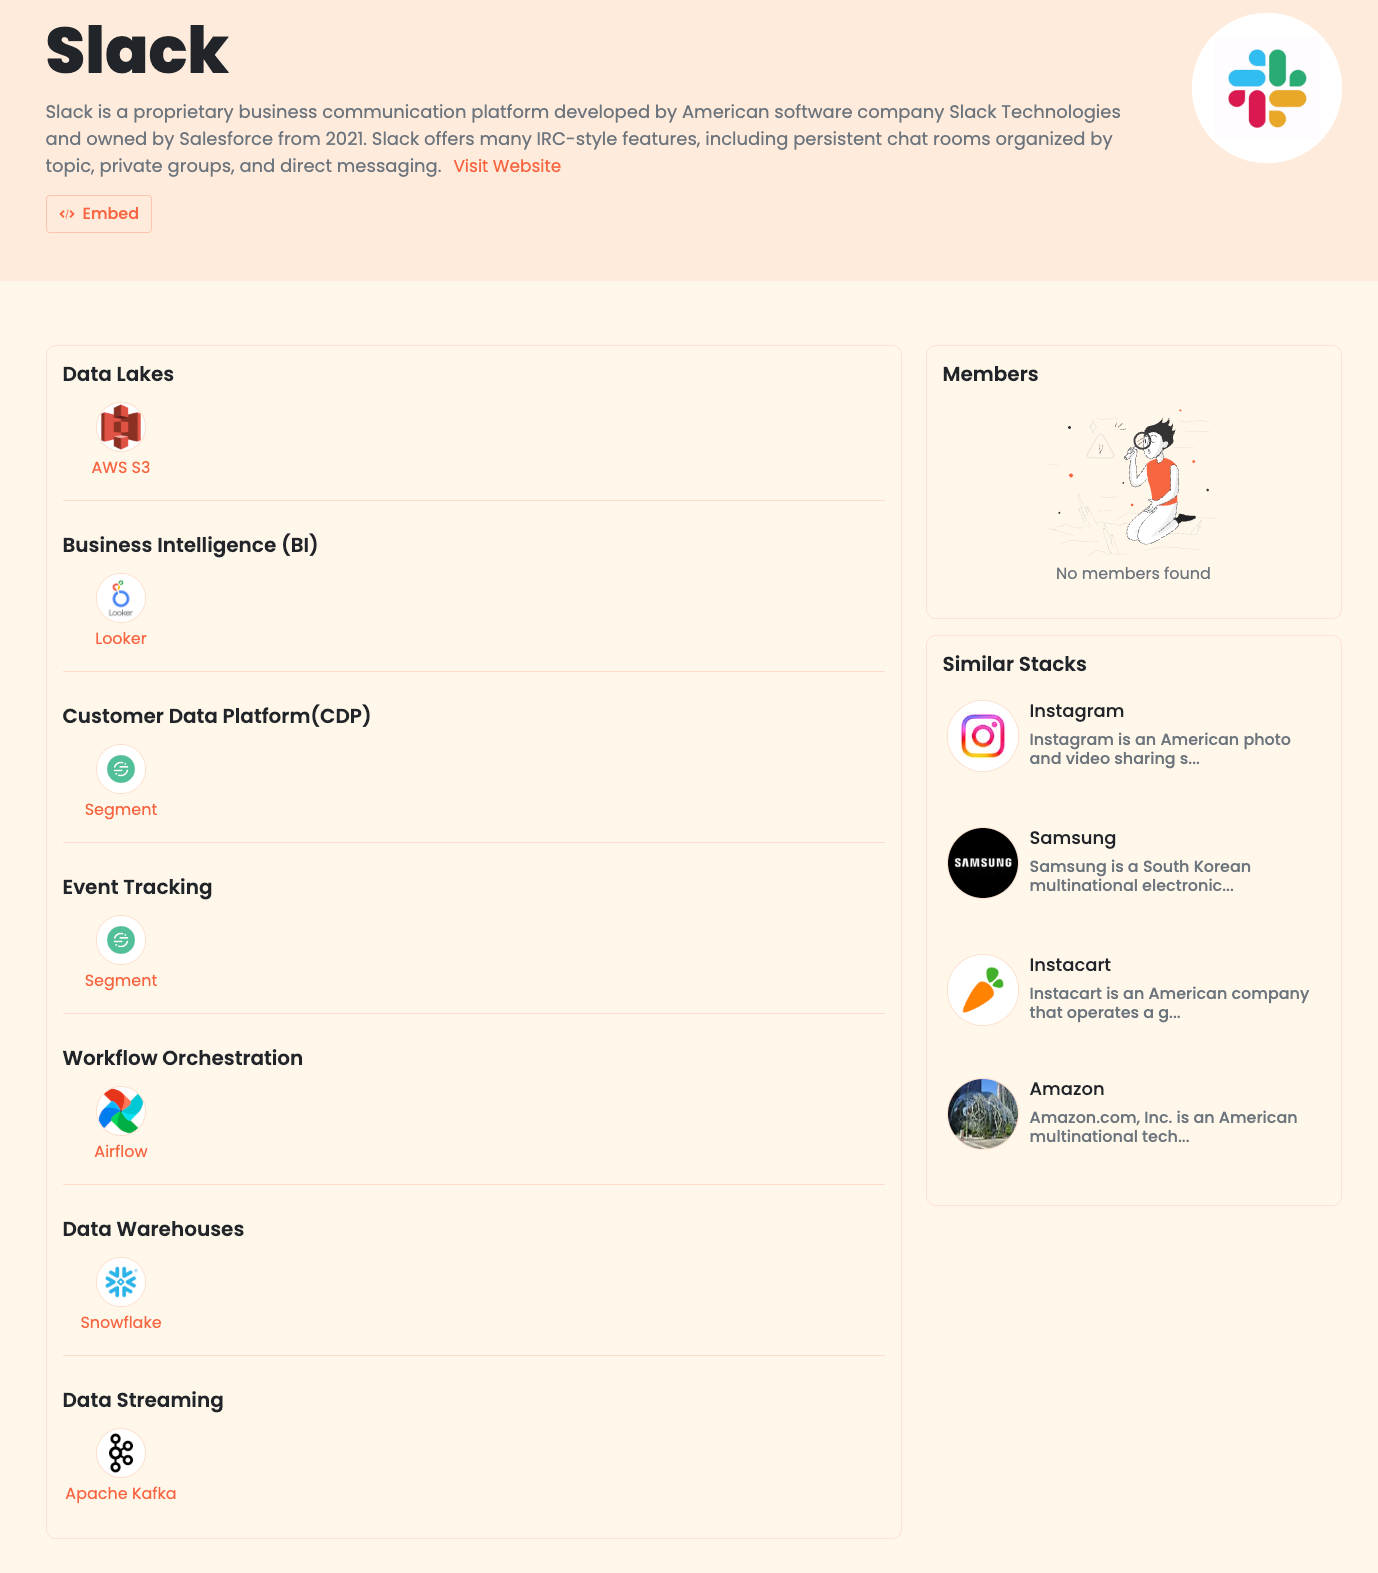
Modern Data Stack website: for data-focused accounts.


Digital Footprint (Finding Public Data That Matters):
Repvue: Check company quota attainment, tech stack, sales team structure, salaries, and how they perform compared to their industry.
Glassdoor: Get insights into HR, interview process, benefits, and employee reviews.
Want the rest of the ICP recipe?
The real magic starts now: Enrich your data, dig into qualitative insights, mix hard numbers with real customer convos, and even build an ML model.
🔓 Paid subscribers get it all: templates, AI prompts, and real-world examples.
Keep reading with a 7-day free trial
Subscribe to Outbound Kitchen to keep reading this post and get 7 days of free access to the full post archives.